
Venn Diagrams
A Venn diagram (also known as a Venn-Euler diagram) is an illustrative schematic used to represent sets, their elements, and the logical relationships between them.
This visual tool uses closed curves in the plane—typically circles or ellipses—to group the elements of a set. In this way, abstract operations of set membership and interactions between collections acquire a geometric interpretation.
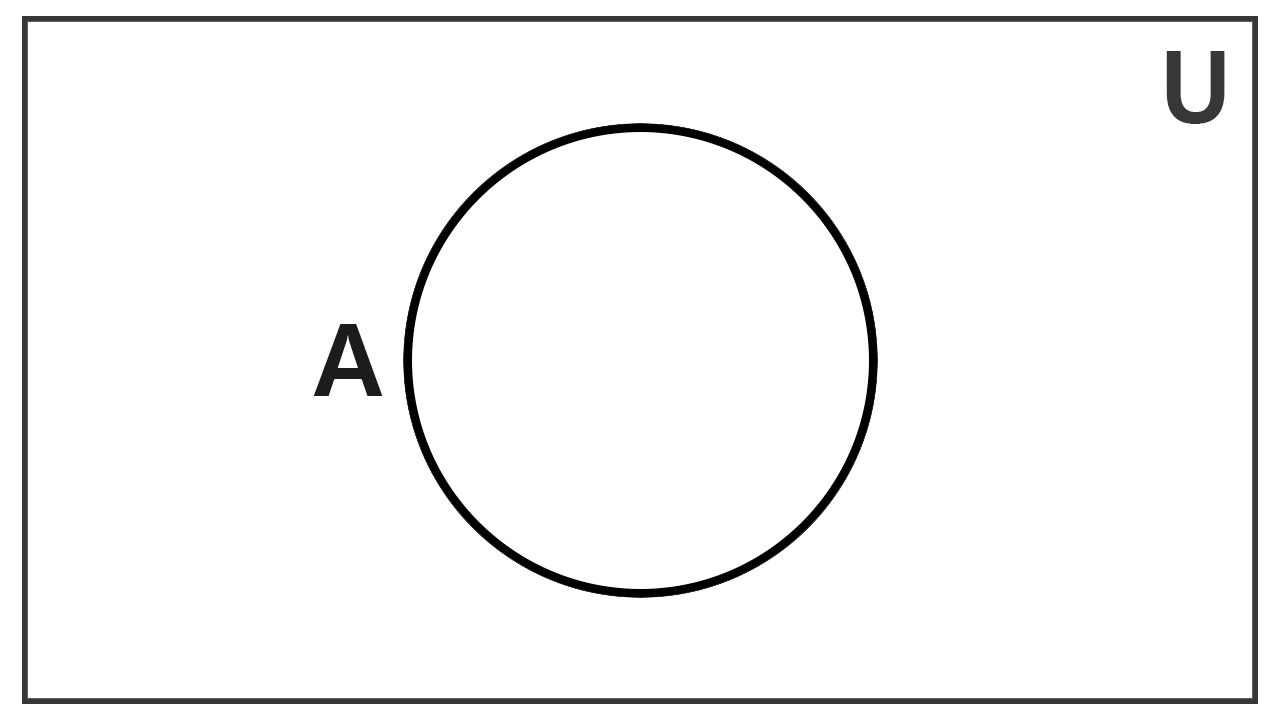
In the basic structure of any diagram, an outer rectangular region is used to delimit the universal set, traditionally denoted by the capital letter U. Every element relevant to the given context is contained within this boundary.
Inside this rectangle, circular curves are drawn to represent each individual set. Points or elements located strictly within a curve belong to that collection, while those situated outside it but within the rectangle correspond to the rest of the universal set under analysis.
The primary purpose of Venn diagrams is to simplify the analysis of Boolean operations and algebraic relationships. By transforming membership propositions into visual areas, they facilitate the understanding of intersections, unions, and complements without relying exclusively on formal proofs.
It is worth making a theoretical clarification regarding the naming of these diagrams. From a rigorous historical and mathematical perspective, the diagrams developed by John Venn require representing every theoretically possible region between the sets under consideration, shading or marking regions that turn out to be empty.
In contrast, the diagrams previously proposed by Leonhard Euler only depict regions that contain actual elements, omitting any overlap if two collections do not intersect. Despite this conceptual distinction, in standard textbooks and practice it is common to use the term Venn diagram or Euler-Venn diagram to describe any plane diagram based on closed curves.
Table of Contents
How to Draw a Venn Diagram
The general procedure for representing any collection of data can be summarized in the following steps:
- Delimit the universal set by drawing a reference rectangle that contains all the elements in the problem, typically labeled with the letter U.
- Analyze the logical relationships between the collections to determine whether they share elements, are completely disjoint, or if one is contained within another.
- Draw the closed curves (circles or ellipses) accordingly: overlapping, separate, or nested, labeling the sets as needed.
- Distribute the elements working from the inside out: place elements in the common intersections first, then in the exclusive regions, and finally place elements that belong strictly to the outer universal set.
Based on this method, the arrangement of curves in the plane gives rise to different types of Venn diagrams depending on the relationship between the sets. We examine these below.
Overlapping Sets
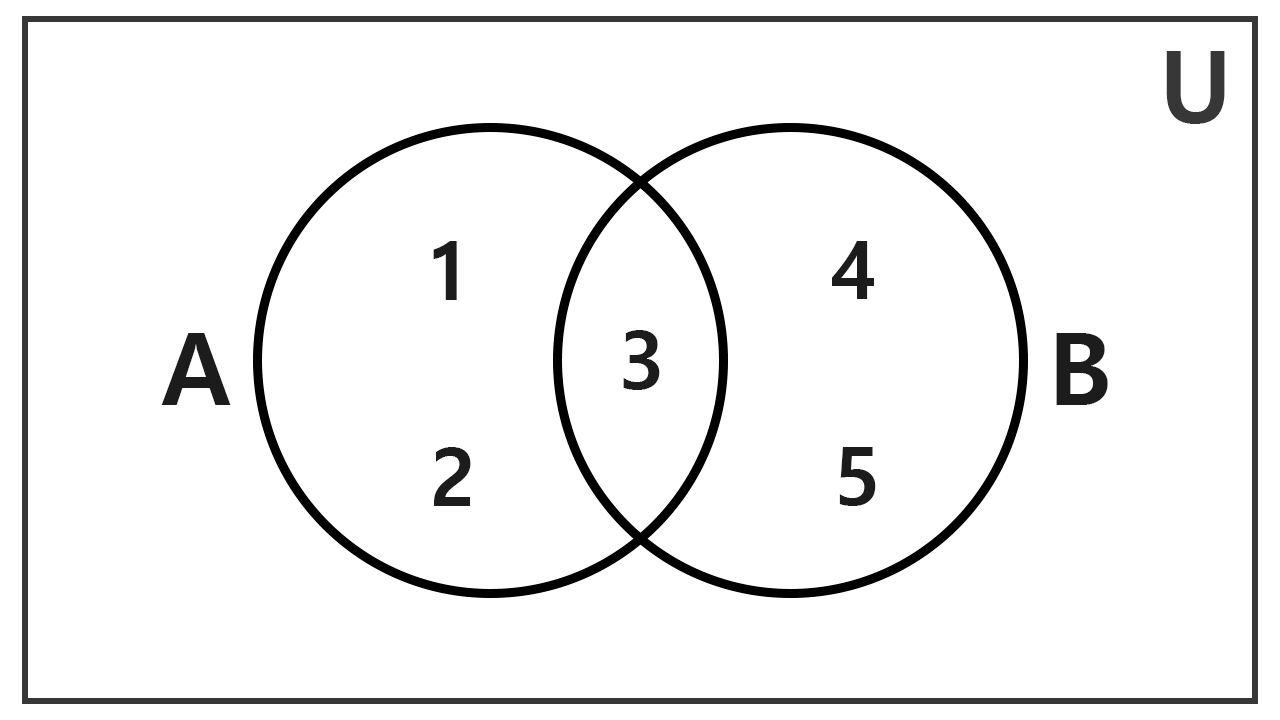
When two sets share at least one element but neither is a subset of the other, they are called non-disjoint sets or overlapping sets. In the plane, their boundaries are drawn partially overlapping. This central region of overlap contains exclusively the shared elements, while the outer crescents contain the elements that belong to only one set.
Consider a first example with the collections A = {1, 2, 3} and B = {3, 4, 5}. Inspecting both groups reveals that they share the number 3, confirming that A ∩ B = {3}. Following the inside-out rule, we first place 3 in the shared central region. Next, we place 1 and 2 in the exclusive region of A, and the values 4 and 5 strictly within the boundary of B.
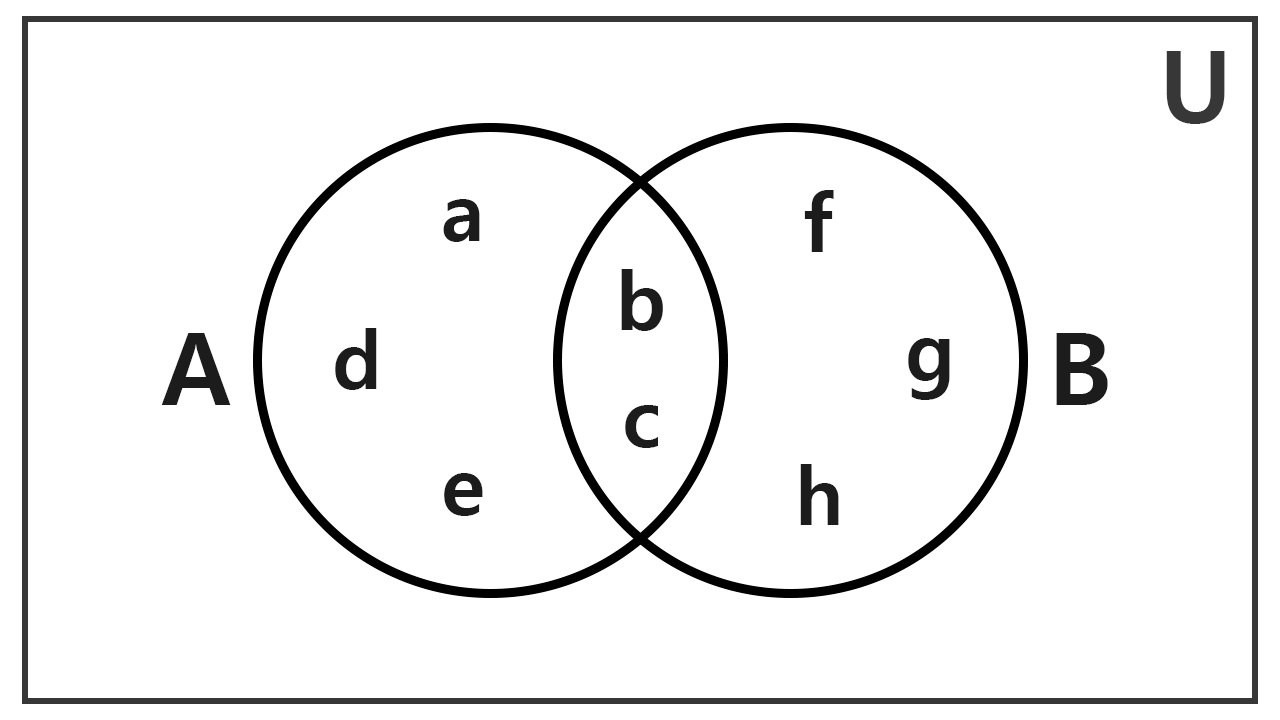
Consider a similar case with a larger number of elements: A = {a, b, c, d, e} and B = {b, c, f, g, h}. Here, the letters b and c appear in both collections.
We place the pair {b, c} in the central intersection. Next, we assign the letters a, d, and e to the exclusive section of A, while distributing f, g, and h in the exclusive region of B.
Disjoint Sets
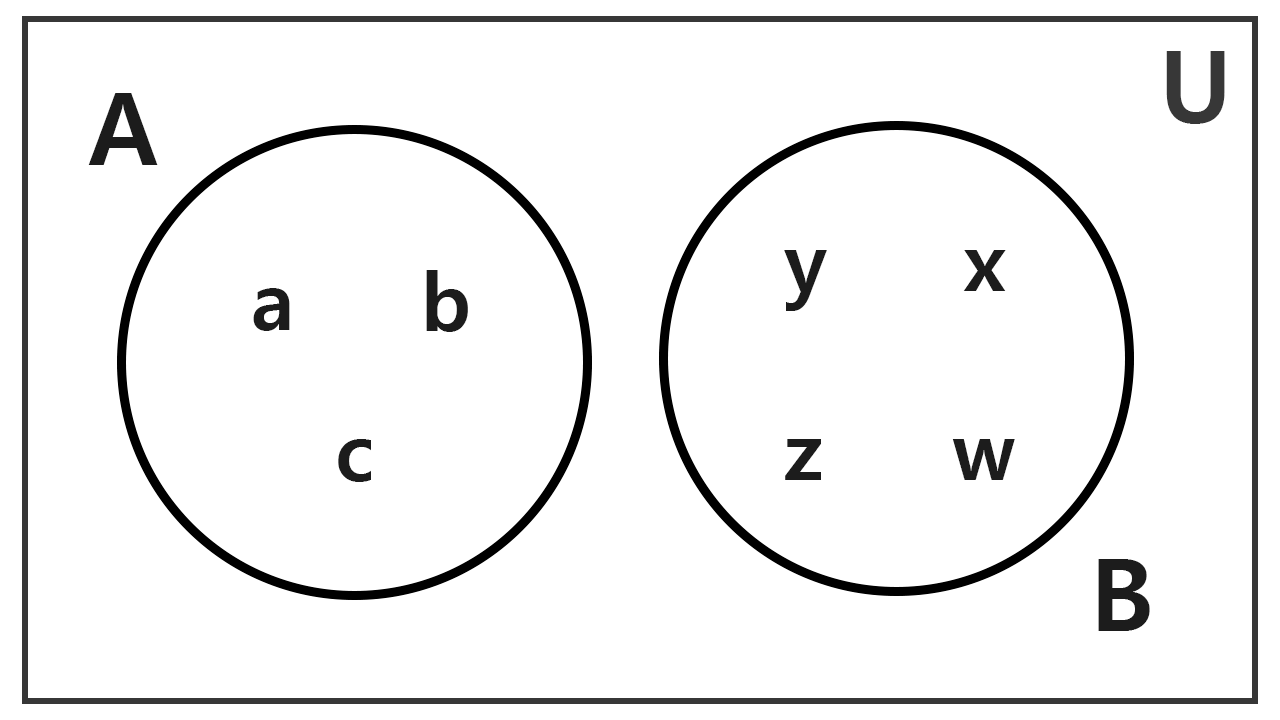
If two collections share no elements in common, they are called disjoint sets. In algebraic terms, their relationship is written as A ∩ B = ∅. Because there are no shared values, the curves must be drawn completely separated within the universal rectangle, without touching or overlapping.
Take the sets A = {a, b, c} and B = {w, x, y, z} as an example. Since no letter appears in both groups, there is no shared central region. Therefore, we draw two separate circles: writing a, b, and c inside the curve for A, and placing w, x, y, and z inside the curve for B.
Subsets
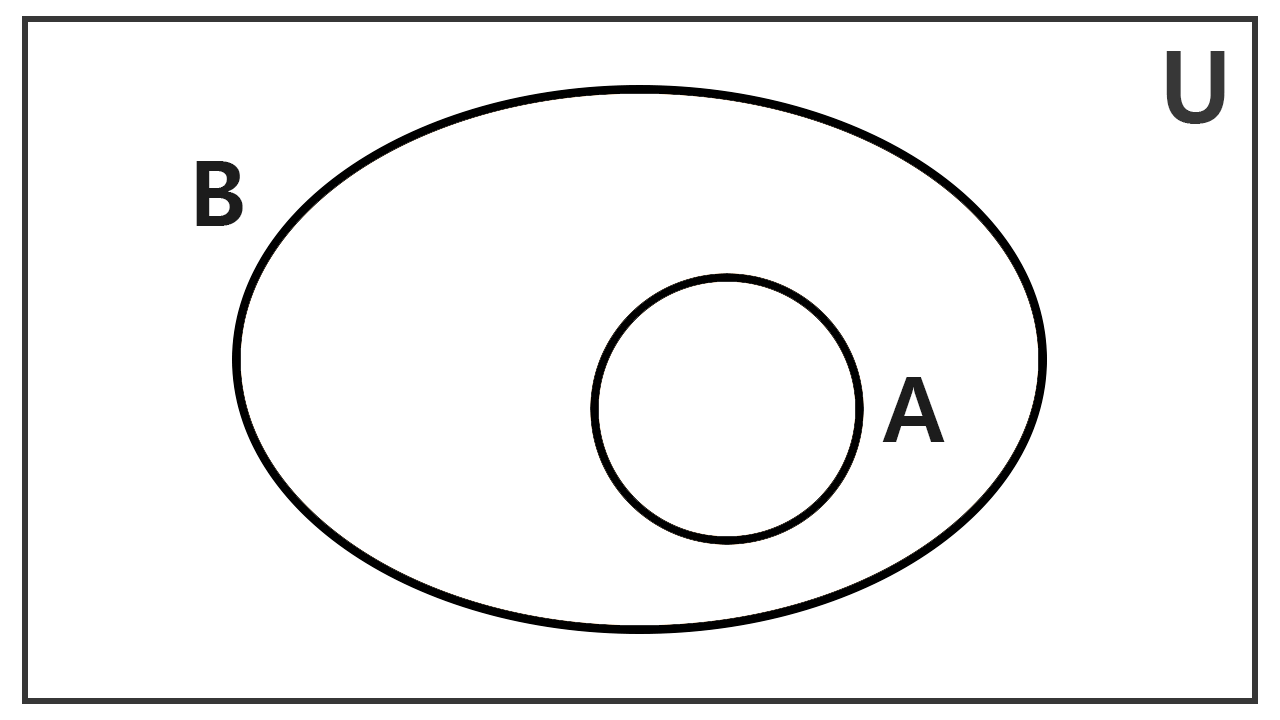
We speak of subset inclusion when every element of one set also belongs to another set. This relationship is formally denoted as A ⊆ B.
In a Venn diagram, this property is illustrated by placing the curve for the included set A entirely inside the boundary of the containing set B. Under this arrangement, there are no elements in A that lie outside B, making it unnecessary to draw a standard overlapping region.
Three-Set Venn Diagrams
When a third set is added, the plane is theoretically divided into 8 regions (23), created by the simultaneous interaction of all collections with the universal set.
Distributing elements continues with the inside-out rule: first place elements in the triple intersection (elements common to all three sets), then in the pairwise intersections exclusive to two sets, followed by the elements exclusive to each set, and finally any external elements in the universal set.
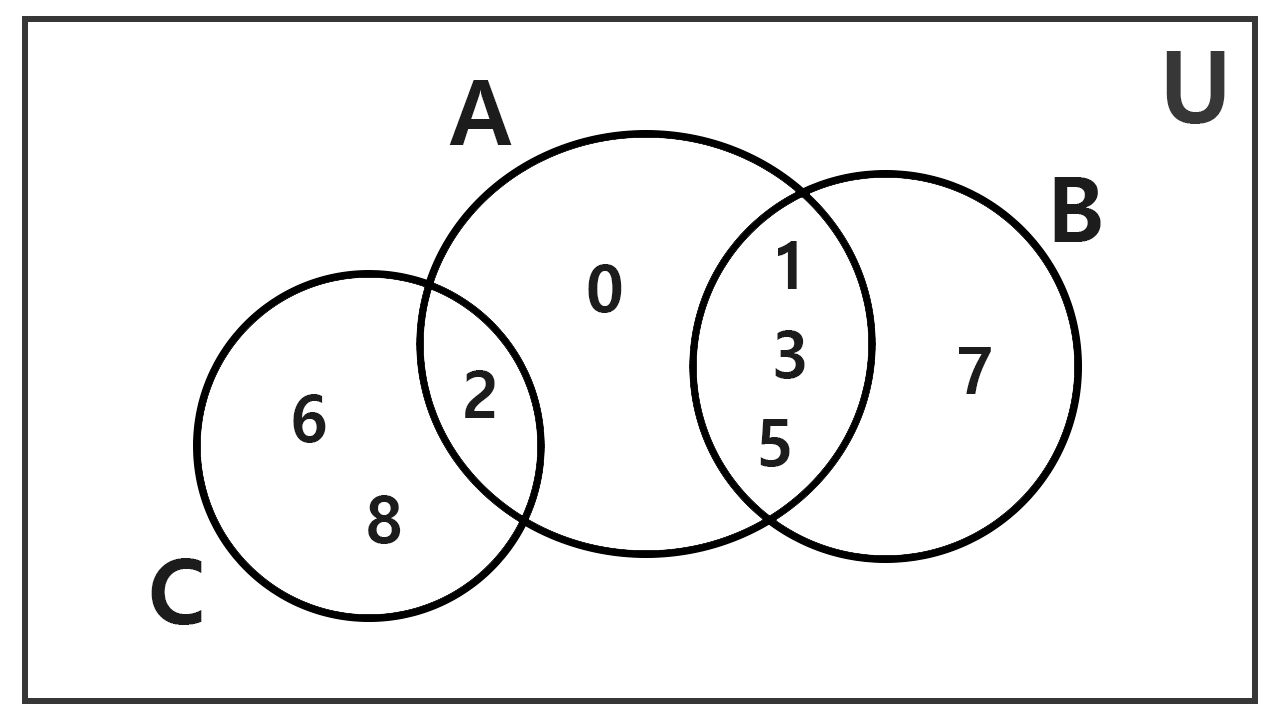
Consider an example with partial intersections and internal disjointness using A = {0, 1, 2, 3, 5}, B = {1, 3, 5, 7}, and C = {2, 6, 8}. We see that A and B share the elements {1, 3, 5}, while A and C share only the number 2.
There are no elements common to both B and C, meaning the triple intersection is empty. We place the shared elements in their respective pairwise intersections and complete the individual regions with 0 in A, 7 in B, and {6, 8} in C.
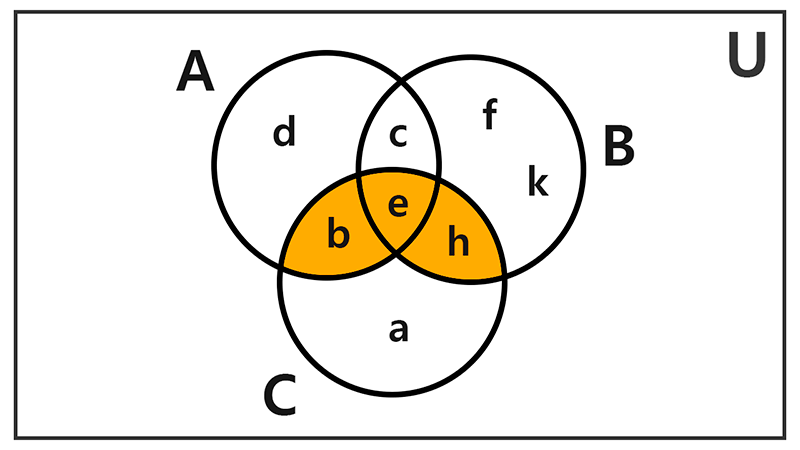
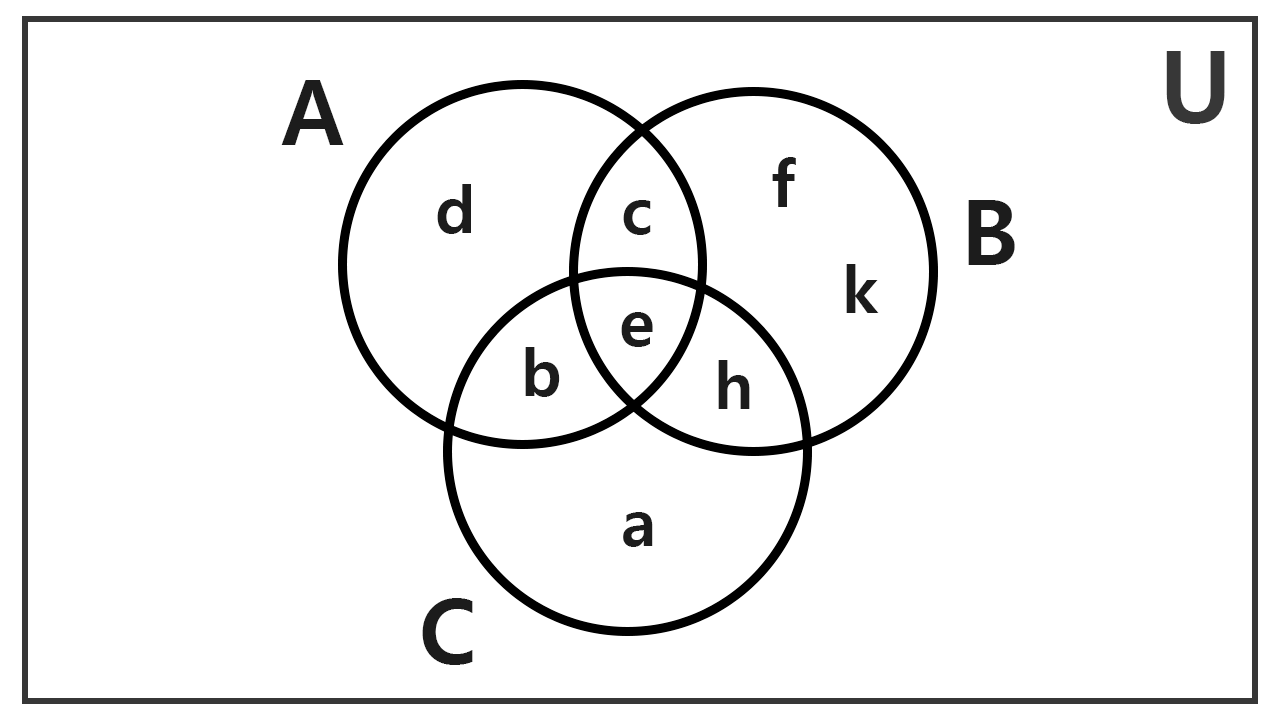
Now consider a complete configuration where every possible region contains elements. Let the collections be A = {b, c, d, e}, B = {c, e, f, h, k}, and C = {a, b, e, h}.
The element e belongs to all three collections simultaneously, so it is placed in the center of the diagram. Evaluating the sets in pairs, we find that c is common to A and B, b is common to A and C, and h is shared by B and C. Once these values are positioned, we complete the exclusive regions: the letter d in A, the letters f and k in B, and the letter a in C, creating an exhaustive partition of the diagram.
It is worth noting that when working with four or more sets, it is not geometrically possible to represent all 2n theoretical intersections using regular circles in the plane. In such advanced cases, elongated ellipses or specialized interlocking curves are used to ensure no logical combinations are omitted.
Representing Set Operations with Venn Diagrams
Venn diagrams provide a geometric interpretation for the results of set operations. By shading specific regions, we can clearly identify which elements belong to the resulting set.
Union of Sets (A ∪ B)
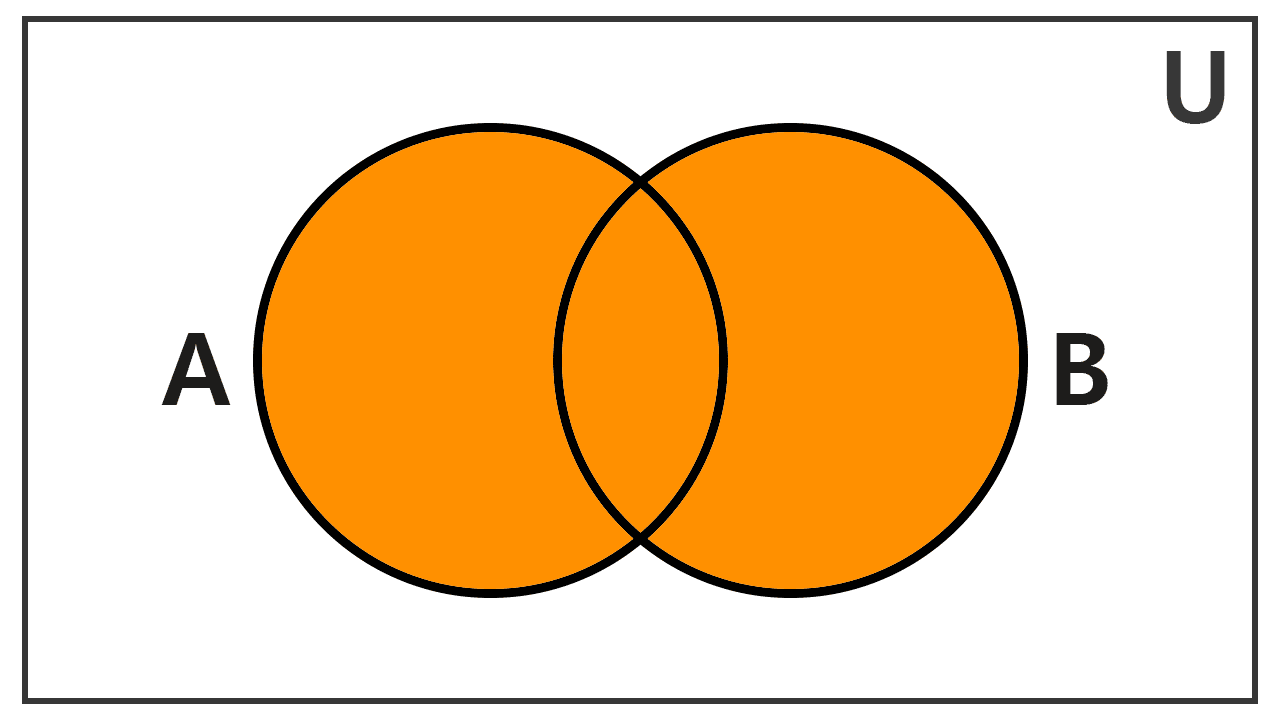
The union combines all elements that belong to set A, set B, or both. It is formally defined as A ∪ B = {x | x ∈ A ∨ x ∈ B}.
In the diagram, this operation is represented by shading both circular regions completely. The colored area covers both exclusive crescents as well as the central overlapping region.
Intersection of Sets (A ∩ B)
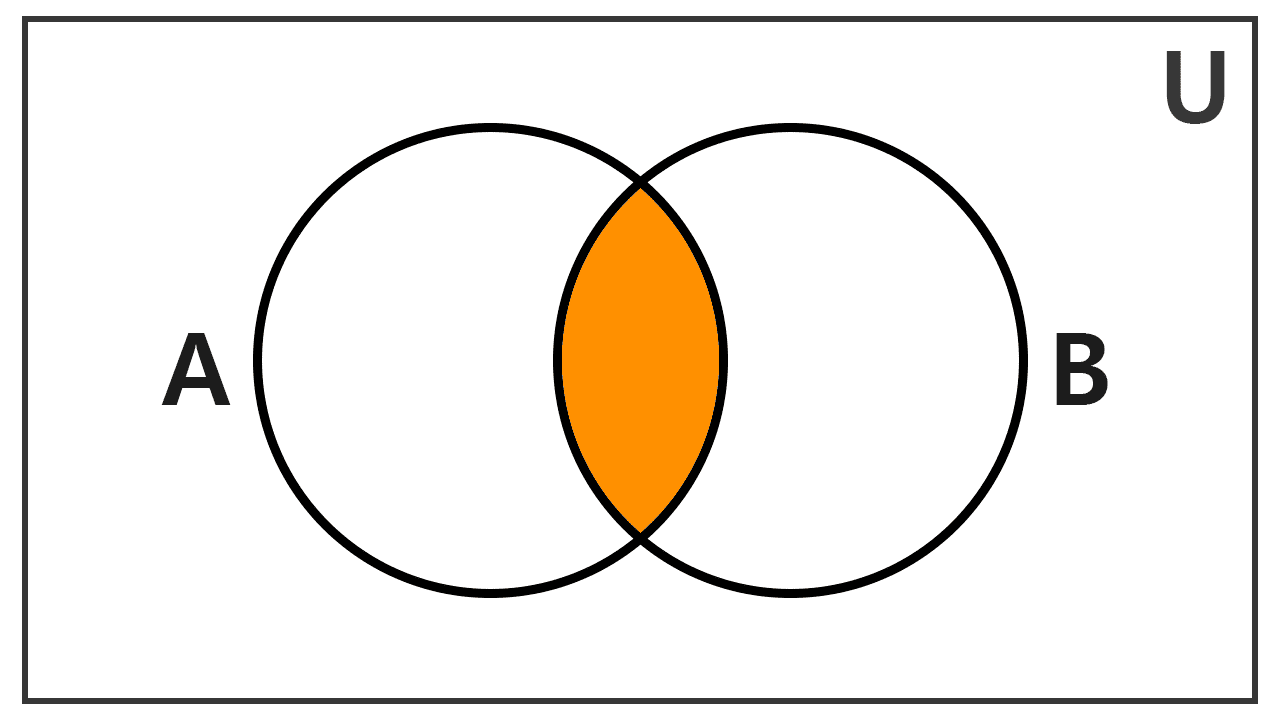
The intersection includes only those elements that belong to both A and B simultaneously. In set-builder notation, it is written as A ∩ B = {x | x ∈ A ∧ x ∈ B}.
Visually, the shading is restricted exclusively to the central overlapping lens. Regions belonging to only one of the two sets remain unshaded.
Set Difference (A − B)
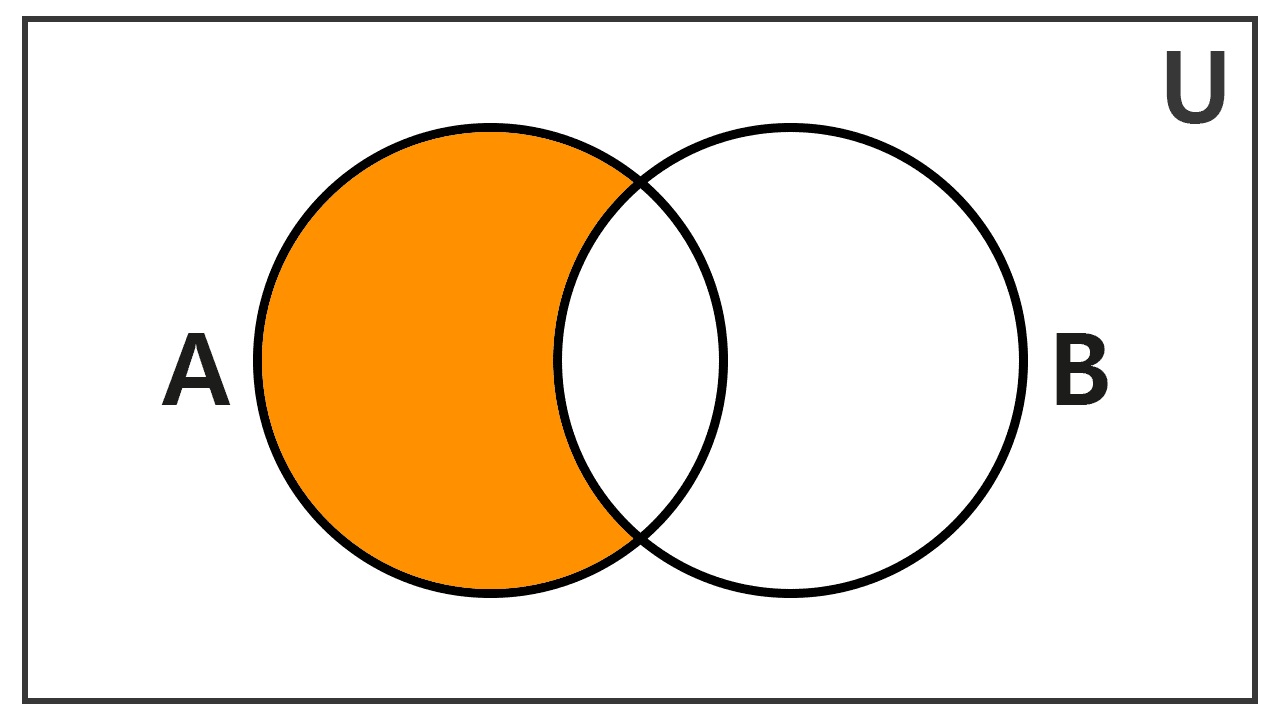
The set difference contains all elements that belong to the first set but do not belong to the second set. Formally, it is stated as A − B = {x | x ∈ A ∧ x ∉ B}.
In the diagram, only the exclusive crescent of set A is shaded. The shared intersection and the entire region for B remain completely blank.
Symmetric Difference (A Δ B)
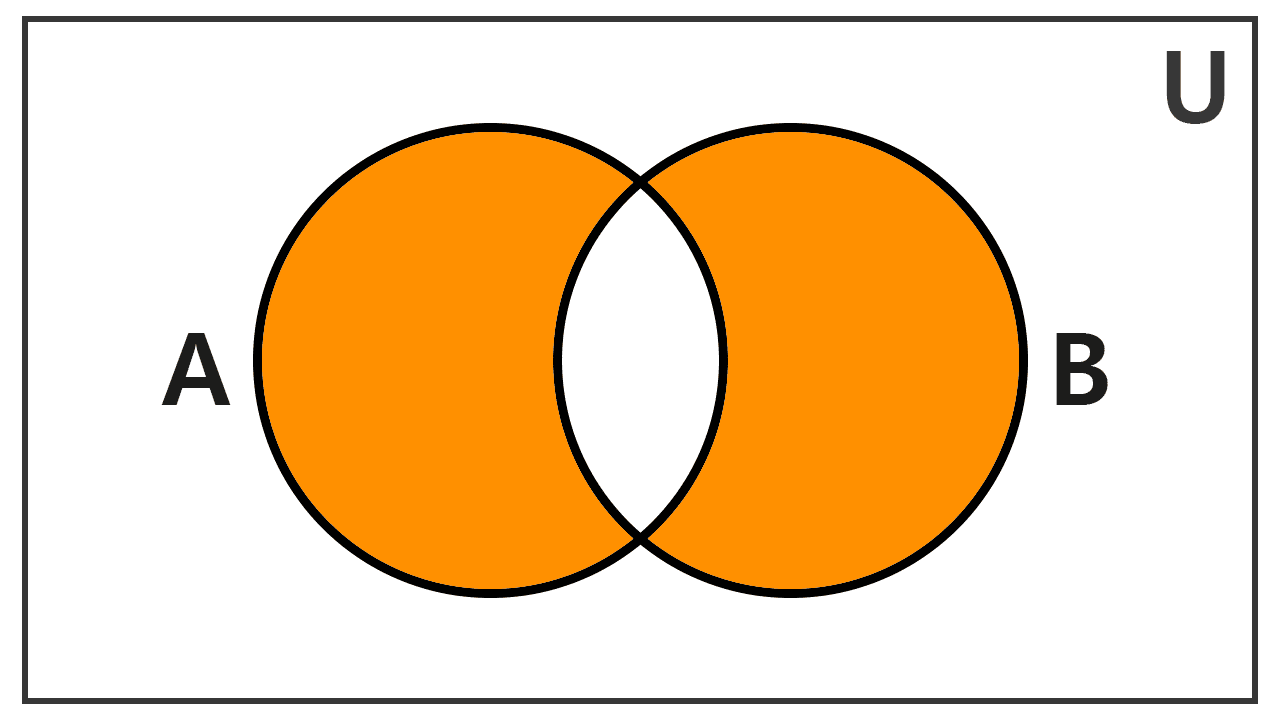
The symmetric difference consists of those elements that belong to A or B, but not to both at the same time. In set-builder notation: A Δ B = {x | (x ∈ A ∨ x ∈ B) ∧ x ∉ (A ∩ B)}.
To graph this operation, we shade both outer crescents of the sets and leave the central overlap blank. This visually represents the union of both individual differences, that is, (A − B) ∪ (B − A).
Complement of a Set (A′)
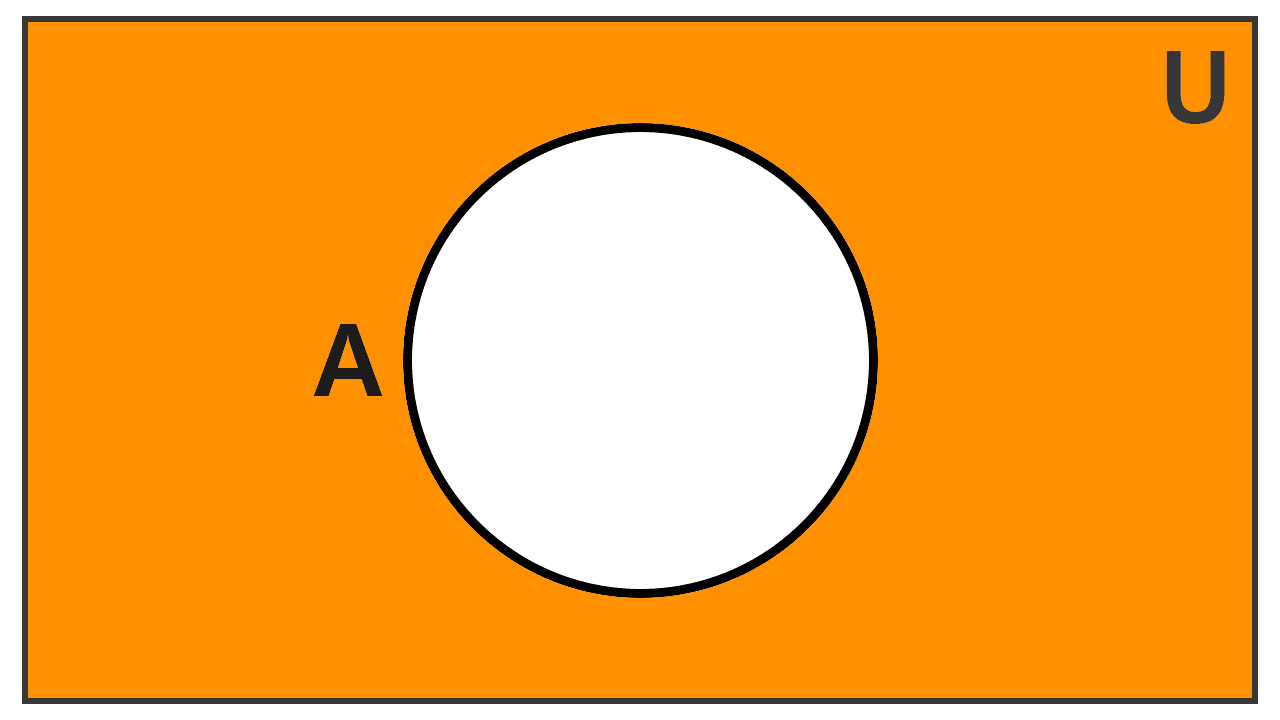
The complement contains all elements of the universal set U that do not belong to set A. It is defined in set-builder notation as A′ = {x ∈ U | x ∉ A}.
In the diagram, the shading covers the entire rectangular area of the universal set, leaving the interior circle for A unshaded.
Applications of Venn Diagrams
The usefulness of Venn diagrams extends beyond basic set representation. By modeling membership, exclusion, and overlap, they serve as a valuable analytical tool across multiple quantitative and deductive disciplines.
Propositional Logic and Deductive Reasoning
In formal logic, these diagrams allow checking the validity of syllogisms and categorical arguments by mapping verbal premises into bounded spatial regions.
There is a direct correspondence between basic logical connectives and set operations:
- Conjunction (∧) corresponds to intersection (∩), indicating that two conditions must hold simultaneously.
- Inclusive disjunction (∨) corresponds to union (∪), grouping cases where at least one condition holds true.
- Negation (¬) corresponds to the complement (′), covering the entire universe outside the condition being evaluated.
Through this analogy, we can verify whether a deductive argument is valid without needing to construct full truth tables.
Counting Problems and Cardinality
One of the most widespread applications is organizing numerical data from surveys, censuses, or statistical classifications. The diagram helps prevent double-counting individuals who share multiple attributes.
By distributing counts from the innermost intersection outward toward the periphery, it becomes clear how many elements belong exclusively to one group, how many overlap across multiple groups, and how many fall outside all considered conditions.
This visual breakdown forms the intuitive basis of the principle of inclusion-exclusion, enabling quick calculation of subtotals and overall totals through simple arithmetic addition and subtraction.
Probability Theory
In probability theory, the universal set rectangle represents the complete sample space, which carries a total probability of 1.
Closed curves represent specific events. This layout immediately distinguishes mutually exclusive events (drawn as separate regions) from non-mutually exclusive events that share a non-zero joint probability.
The diagram also simplifies the analysis of conditional probability. When calculating the probability of one event given that another has occurred, the reference area visually narrows to the boundary of the conditioning event.
Computer Science and Boolean Logic
In computer science, Venn diagrams illustrate the behavior of Boolean operators used in query filtering, database searches, and algorithm design.
Information retrieval in digital repositories and search systems relies directly on these set intersections:
- The AND operator narrows results to the exact intersection of two or more criteria.
- The OR operator expands results to the union of all matching records.
- The NOT operator excludes specific records using set complementation.
These principles help in designing efficient search filters, database queries, and large-scale data validation routines.
Decision-Making and Comparative Analysis
In professional and organizational settings, these diagrams are used to map complex relationships in a concise, accessible format.
They are useful for project planning when outlining shared responsibilities between teams, evaluating candidate skill requirements for job profiles, or identifying competing dependencies for limited resources.
In education, they serve as visual organizers for comparing theories, concepts, or historical periods, helping learners distinguish core commonalities from unique differences.
Did you find this useful? Rate it!
0.0 / 5 — 0 votes

HOW TO CITE THIS ARTICLE
Machado, D. (2026, October 1). Venn Diagrams. Flamath. https://en.flamath.com/venn-diagrams
Leave a Reply
Related Articles